
Choosing the right chart
Here's a first draft of something I've been working on for a while. I've always wanted a (relatively) simple taxonomy of charts, organized by purpose. The way to read this page is to start in the center: what are you trying to show? If you want to show a comparison, then follow the tree in the upper left, if distribution of data, then upper right, and so on.
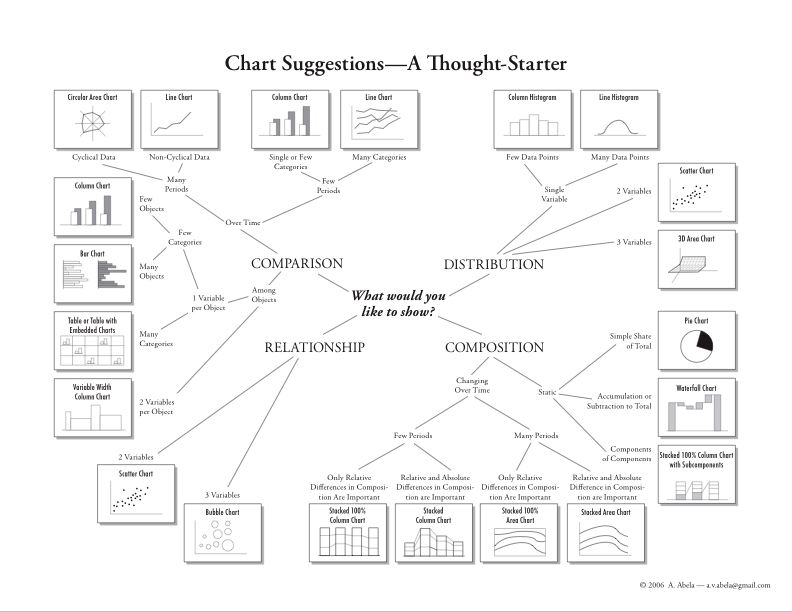
I used this for the first time this week, in two workshops, and it was well received. That said, it's only a first draft and I welcome any comments.
posted by Dr. Abela @ 8:32 PM
![]()
![]()
0 Comments:
Post a Comment
<< Home